Published on December 6, 2022
Last Friday (2nd December) the European Commission gave the go ahead for France to ban flights between Paris Orly airport and Nantes, Lyon, and Bordeaux. France wants to ban flights between cities that are linked by a train journey of less than 2hr 30min, as part of environmental measures.
This got me thinking about what the effect would be of a similar ban in the UK, and indeed how much domestic air travel we have where rail is a viable alternative.
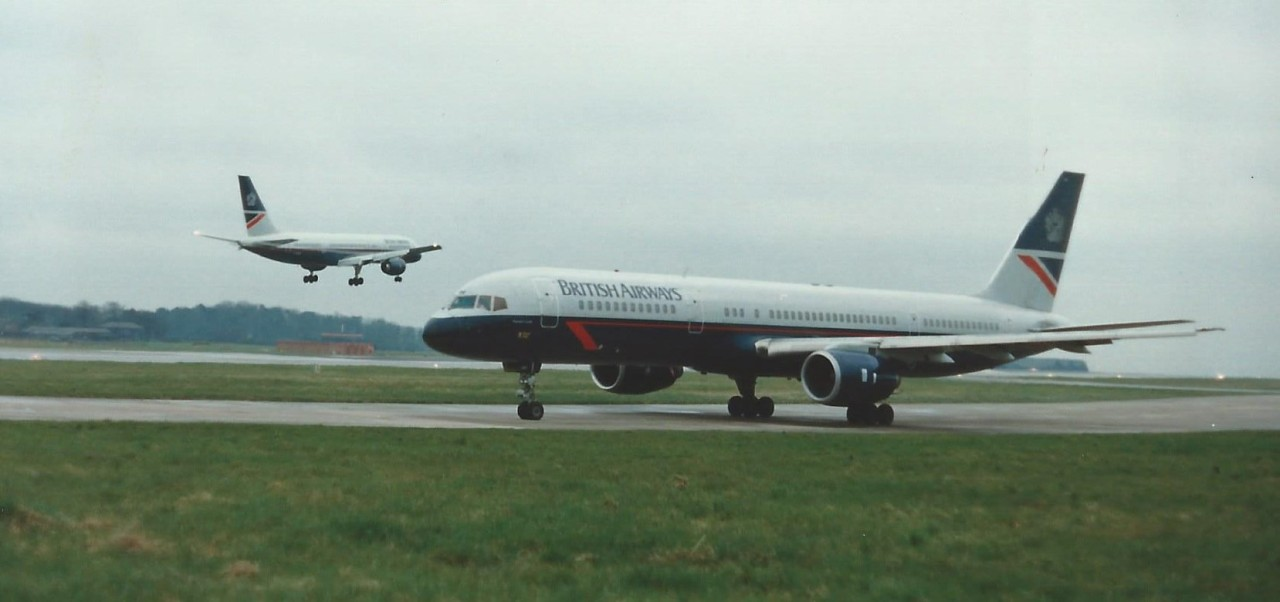
I started my career in aviation, working for British Airways in the 1990s. This was a boom time for domestic aviation, with the extensive 'turn-up and fly' Super Shuttle network to/from London, along with a wider domestic network from other regional cities.
A corner of Heathrow's terminal 1 was devoted to BA's domestic network, and Manchester even had the whole 'Terminal A' dedicated to domestic flights.
I moved from aviation to public transport in 2000, and over the years I've watched that domestic flight network fade to a shadow of its former self. My perception was that domestic air travel had gradually faded from prominence, as flying has become more cumbersome, and domestic rail frequencies improved.
However, a couple of colleagues challenged this assumption, asserting that domestic flights are just as popular as ever.
This prompted me to dig into the data, and understand the make-up of our current domestic flight market, and where people are still choosing to fly, where rail may be a timely alternative.
I downloaded the most recent air passenger journey statistics from the CAA website, covering the month of September 2022. These provide a count of domestic airline passengers (scheduled and chartered) for each of the 223 origin/destination combinations served in the UK in September. In total there were 1.4m domestic flight passengers in the month, (of note, this includes passengers making a domestic connection to an international flight).
For each of these routes, I then used FastJP to look-up the fastest weekday rail journey time (using Thursday 8th December timetable) for each route. I did this between the main city/town rail stations for the city/town served by the airport.
For example, flights from Heathrow are compared with train journeys from London; flights from Teesside are compared with rail journeys from Darlington; etc. This is imperfect, as we don't know the actual origin/destination of individual passengers, but in balance they are more likely to be to/from the town / city served, than the airport itself.
Islands
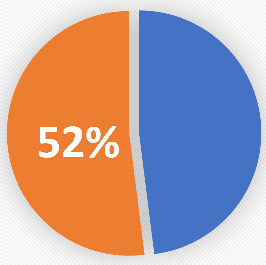
The first point I noted, is that we define 'domestic' as 'within the UK and adjacent British Crown Dependencies' - i.e. that includes Northern Ireland, Scottish islands, Isle of Man, Scilly, and the Channel Islands. These are routes where there is no rail alternative. Flights to/from islands make up 52.5% of our domestic flights.
Anglo-Scot
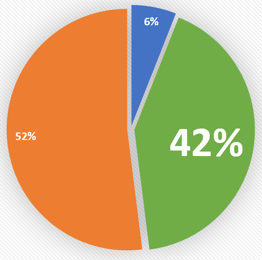
The next largest category of flights are those between England and Scotland, accounting for 41.7% of all passenger journeys (around 585,000 passengers in the month). By way of comparison, there were just under 10m rail passengers between England and Scotland in the 12 months prior to Covid, which had grown from 7m in 2010 (albeit this will include some shorter cross-border journeys)
The rest
The vast majority of the remainder are flights entirely within England (81,000 / 5.8%), the majority being between Manchester and London, and Newcastle and London.
If the UK banned flights where there is a suitable rail alternative
If the UK applied the same 2hr 30min threshold as France, then that would ban the flights between Manchester - London, and Leeds - London (albeit the latter were scrapped by FlyBe last month anyway). This would ban about 1.8% of domestic flights.
Extending to 4hrs would remove Newcastle - London, (and two very small routes: Edinburgh - Manchester, and East Midlands - Newcastle), taking the total to 3.5%.
You would need to extend a ban to 5hrs to remove the majority of the London - Scotland routes, taking the total to about 30% of domestic journeys.
If you extended the ban to any route where there is a rail alternative of any duration, you would ban just under half of domestic flights.
Edit: You can explore the full 2022 data in Tableau here:
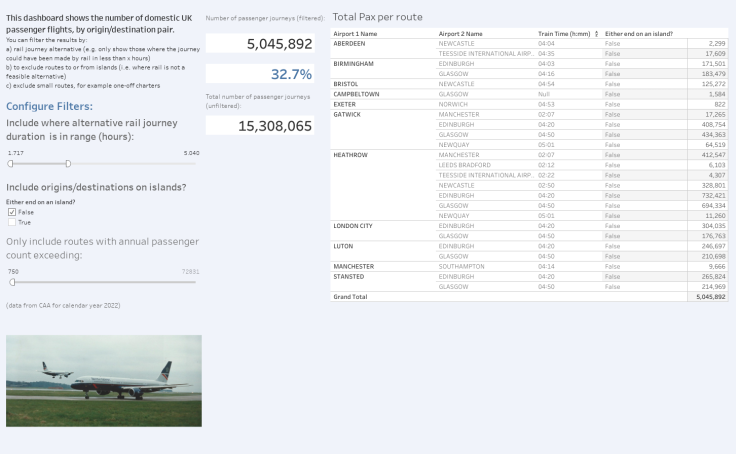
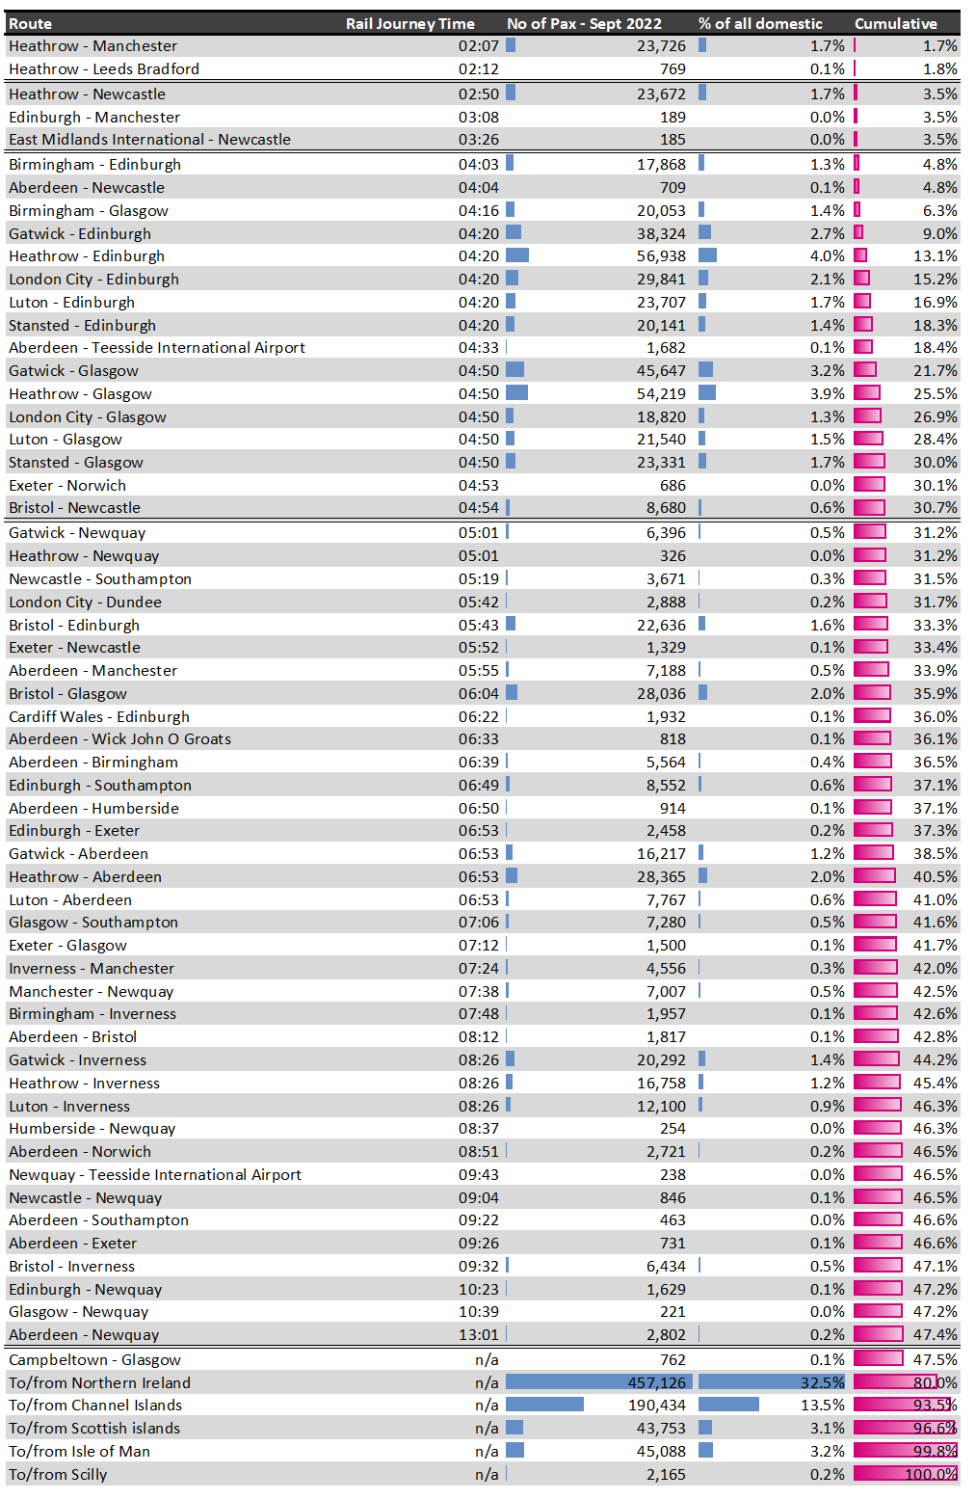
Tabular version of above image:
| Route | Rail Journey Time | No of Pax - Sept 2022 | % of all domestic | Cumulative |
|---|---|---|---|---|
| Heathrow - Manchester | 02:07 | 23,726 | 1.7% | 1.7% |
| Heathrow - Leeds Bradfor | 02:12 | 769 | 0.1% | 1.8% |
| Heathrow - Newcastle | 02:50 | 23,672 | 1.7% | 3.5% |
| Edinburgh - Manchester | 03:08 | 189 | 0.0% | 3.5% |
| East Midlands Internation | 03:26 | 185 | 0.0% | 3.5% |
| Birmingham - Edinburgh | 04:03 | 17,868 | 1.3% | 4.8% |
| Aberdeen - Newcastle | 04:04 | 709 | 0.1% | 4.8% |
| Birmingham - Glasgow | 04:16 | 20,053 | 1.4% | 6.3% |
| Gatwick - Edinburgh | 04:20 | 38,324 | 2.7% | 9.0% |
| Heathrow - Edinburgh | 04:20 | 56,938 | 4.0% | 13.1% |
| London City - Edinburgh | 04:20 | 29,841 | 2.1% | 15.2% |
| Luton - Edinburgh | 04:20 | 23,707 | 1.7% | 16.9% |
| Stansted - Edinburgh | 04:20 | 20,141 | 1.4% | 18.3% |
| Aberdeen - Teesside Intern | 04:35 | 1,682 | 0.1% | 18.4% |
| Gatwick - Glasgow | 04:50 | 45,647 | 3.2% | 21.7% |
| Heathrow - Glasgow | 04:50 | 54,219 | 3.9% | 25.5% |
| London City - Glasgow | 04:50 | 18,820 | 1.3% | 26.9% |
| Luton - Glasgow | 04:50 | 21,540 | 1.5% | 28.4% |
| Stansted - Glasgow | 04:50 | 23,331 | 1.7% | 30.0% |
| Exeter - Norwich | 04:53 | 686 | 0.0% | 30.1% |
| Bristol - Newcastle | 04:54 | 8,680 | 0.6% | 30.7% |
| Gatwick - Newquay | 05:01 | 6,396 | 0.5% | 31.2% |
| Heathrow - Newquay | 05:01 | 326 | 0.0% | 31.2% |
| Newcastle - Southampton | 05:19 | 3,671 | 0.3% | 31.5% |
| London City - Dundee | 05:42 | 2,888 | 0.2% | 31.7% |
| Bristol - Edinburgh | 05:43 | 22,636 | 1.6% | 33.3% |
| Exeter - Newcastle | 05:52 | 1,329 | 0.1% | 33.4% |
| Aberdeen - Manchester | 05:55 | 7,188 | 0.5% | 33.9% |
| Bristol - Glasgow | 06:04 | 28,036 | 2.0% | 35.9% |
| Cardiff Wales - Edinburgh | 06:22 | 1,932 | 0.1% | 36.0% |
| Aberdeen - Wick John O G | 06:33 | 818 | 0.1% | 36.1% |
| Aberdeen - Birmingham | 06:39 | 5,564 | 0.4% | 36.5% |
| Edinburgh - Southampton | 06:49 | 8,552 | 0.6% | 37.1% |
| Aberdeen - Humberside | 06:50 | 914 | 0.1% | 37.1% |
| Edinburgh - Exeter | 06:53 | 2,458 | 0.2% | 37.3% |
| Gatwick - Aberdeen | 06:53 | 16,217 | 1.2% | 38.5% |
| Heathrow - Aberdeen | 06:53 | 28,365 | 2.0% | 40.5% |
| Luton - Aberdeen | 06:53 | 7,767 | 0.6% | 41.0% |
| Glasgow - Southampton | 07:06 | 7,280 | 0.5% | 41.6% |
| Exeter - Glasgow | 07:12 | 1,500 | 0.1% | 41.7% |
| Inverness - Manchester | 07:24 | 4,556 | 0.3% | 42.0% |
| Manchester - Newquay | 07:38 | 7,007 | 0.5% | 42.5% |
| Birmingham - Inverness | 07:48 | 1,957 | 0.1% | 42.6% |
| Aberdeen - Bristol | 08:12 | 1,817 | 0.1% | 42.8% |
| Gatwick - Inverness | 08:26 | 20,292 | 1.4% | 44.2% |
| Heathrow - Inverness | 08:26 | 16,758 | 1.2% | 45.4% |
| Luton - Inverness | 08:26 | 12,100 | 0.9% | 46.3% |
| Humberside - Newquay | 08:37 | 254 | 0.0% | 46.3% |
| Aberdeen - Norwich | 08:51 | 2,721 | 0.2% | 46.5% |
| Newquay - Teesside Intern | 09:45 | 238 | 0.0% | 46.5% |
| Newcastle - Newquay | 09:04 | 846 | 0.1% | 46.5% |
| Aberdeen - Southampton | 09:22 | 463 | 0.0% | 46.6% |
| Aberdeen - Exeter | 09:26 | 731 | 0.1% | 46.6% |
| Bristol - Inverness | 09:32 | 6,434 | 0.5% | 47.1% |
| Edinburgh - Newquay | 10:23 | 1,629 | 0.1% | 47.2% |
| Glasgow - Newquay | 10:39 | 221 | 0.0% | 47.2% |
| Aberdeen - Newquay | 13:01 | 2,802 | 0.2% | 47.4% |
| Campbeltown - Glasgow | n/a | 762 | 0.1% | 47.5% |
| To/from Northern Ireland | n/a | 457,126 | 32.5% | 80.0% |
| To/from Channel Islands | n/a | 190,434 | 13.5% | 93.5% |
| To/from Scottish islands | n/a | 43,753 | 3.1% | 96.6% |
| To/from Isle of Man | n/a | 45,088 | 3.2% | 99.8% |
| To/from Scilly | n/a | 2,165 | 0.2% | 100.0% |