Published on January 29, 2019
As Transport Focus publish the latest annual Passenger Satisfaction Survey, it's not a surprise that satisfaction is at it's lowest level for a decade.
What I do find strange each year, however, is the trends within it.
As a regular traveller on the East Coast mainline, I regularly use LNER, Hull Trains, and Grand Central. By almost any measure, Hull Trains has had an awful year - primarily due to fleet availability issues. In some months nearly 20% of services have been cancelled or significantly late, and they were bottom of the PPM league tables. Given the relatively low service frequency to Selby, Brough and Hull - a cancellation often means in excess of a two hour wait. Strangely, however, they rank 4th highest on passenger satisfaction, only beaten by Heathrow Express, Chiltern and Grand Central.
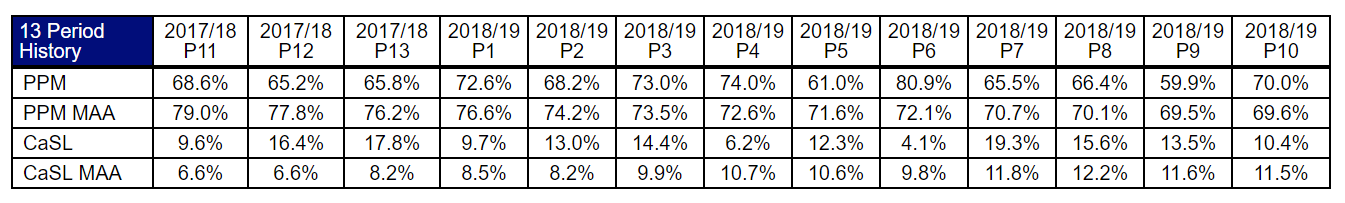
Table 1: Hull Trains performance 2018 (PPM - Passenger Performance Measure; CaSL - Cancelled and Significantly Late)
So if satisfaction isn't all about punctuality, what does drive it?
It's often said that a train company's satisfaction rating is inversely related to the proportion of commuters: carry a lot of commuters, and you'll have poor satisfaction. That sounds rational, commuting is something that few people enjoy.
Looking at the chart below, there is some correlation. All but one of the TOCs with less than 10% commuter revenue are in the top half of the satisfaction league. However, it's far from a perfect conclusion, and TOCs such as c2c and Chiltern have significant commuter bases and still manage to achieve high satisfaction ratings.
Perhaps journey duration is a better factor? Not entirely. Albeit all operators with an average journey length of over 100 miles appear in the top 8. Perhaps it is easier to satisfy customers on a long distance journey? Or perhaps it's more important to offer higher levels of service when coach and air are realistic competitors?
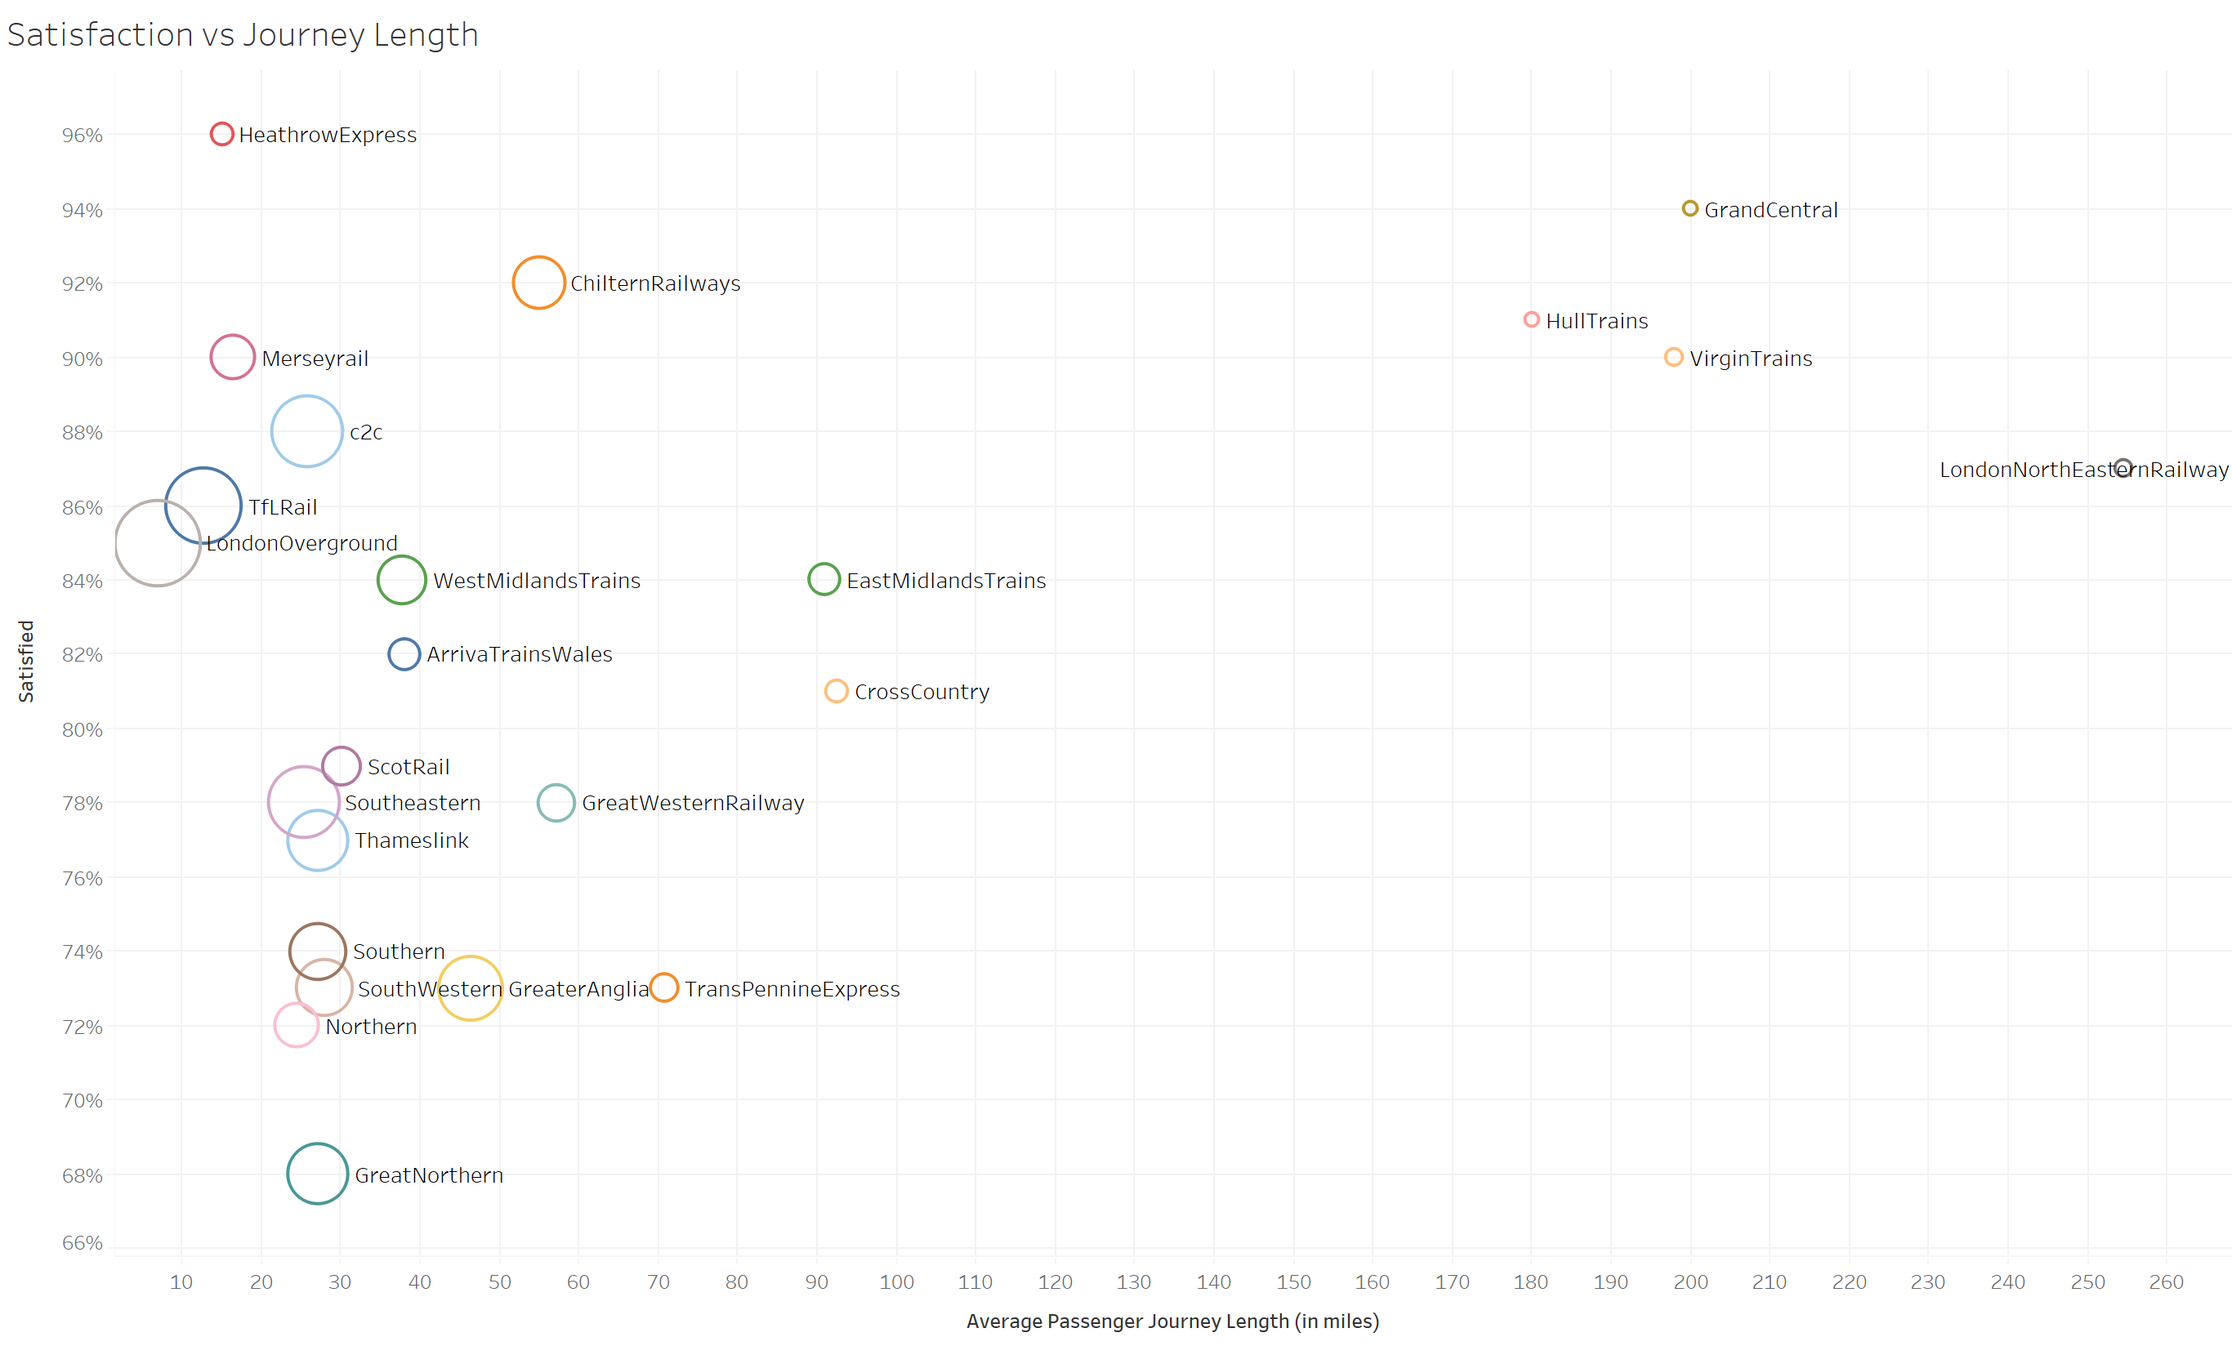
Figure 1: Satisfaction vs Average Passenger Journey Length (size of circle denotes proportion of ticket revenue from season tickets)
I don't want to undermine the hard work those at the top of the league have invested to get there - but the stats prompt some interesting thoughts:
- If a train company that is bottom of the PPM league can have 4th best passenger satisfaction, is our obsession with 'right time' railway always justified?
- How do satisfaction, journey purpose, and journey duration interact? Am I more likely to be satisfied with a journey that I've chosen to make, rather than one I have to make?
- Does higher satisfaction result from better handling of issues and incidents, or is brand loyalty a big factor?
There will no doubt be a bit of self applaud in places, and disappointment in others. Stats are helpful indicators, but these are not measures. The hard work at the bottom of the league table is often least rewarding and least noticed.
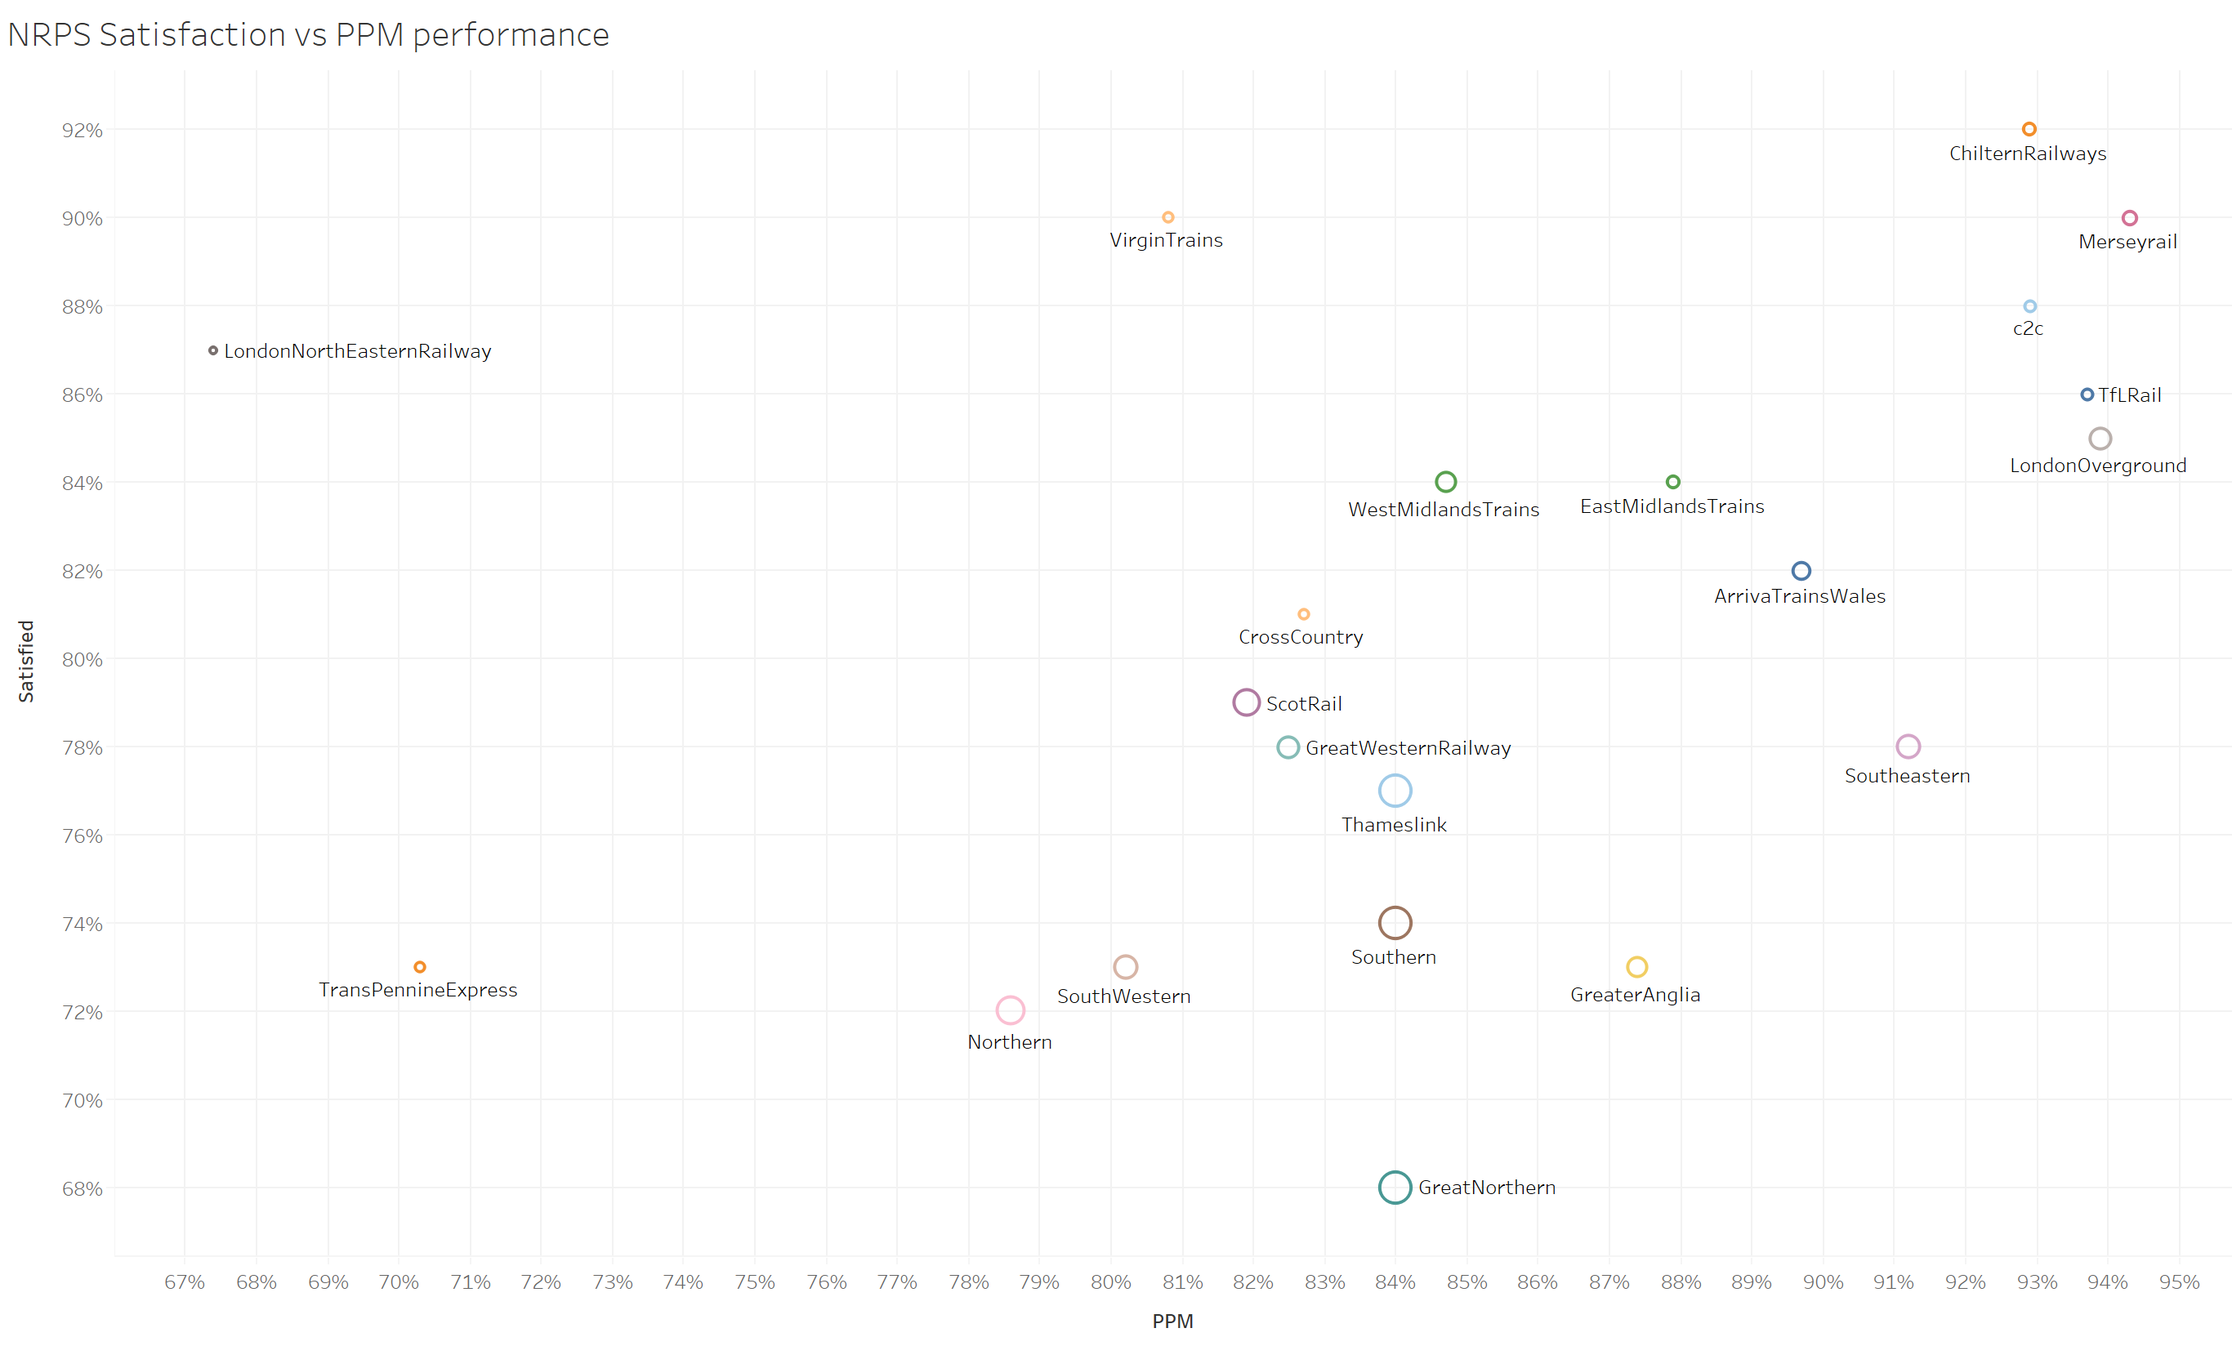
Figure 2: Satisfaction vs Performance (size of circle denotes number of daily services operated)