Published on December 31, 2021
Like many people, I've spent a fair amount of time in 2021 trying to understand the recovery in rail patronage, and speculate where it might head in the coming years. There's a lot of statistics out there, so here's an edited selection that I've found insightful.
(I know others have access to more comprehensive data, and can devote more of their time to it - so this will inevitably be incomplete and imperfect, but nonetheless I hope this is a helpful canter through the headlines)
Leisure travel up, commuting down, season tickets used less
According to Office of Rail and Road statistics, season ticket journeys in Q2 (July - September) were at just 25% of pre-Covid levels, whereas journeys using Advance tickets reached 85%. Season tickets accounted for just 15% of all rail journeys, down from 40% immediately before the pandemic.
However, it's incorrect to say that commuting has dropped as much as season ticket usage, as many part-time commuters will have been using other ticket types such as day tickets and PAYG. The Transport Focus Rail User weekly survey has shown commuting making up a fairly steady 33% - 36% of journeys sampled, implying that the majority of commuters were not using season tickets.
Some working from home an option for most
According to the Transport Focus 'Future of Rail Commuting Survey' from August 2021, 87% of those who previously commuted by rail do not physically need to attend their workplace all the time, and 33% could, in theory, work entirely from home.
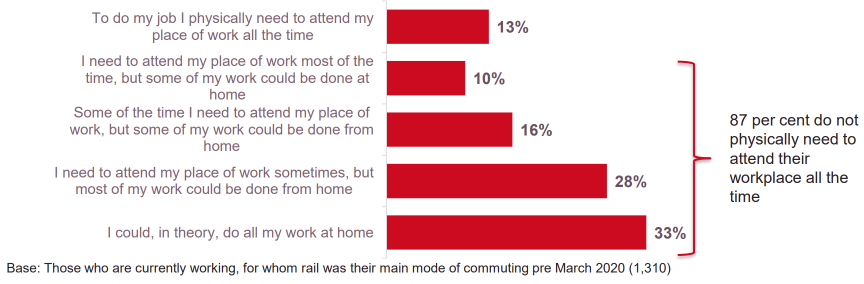
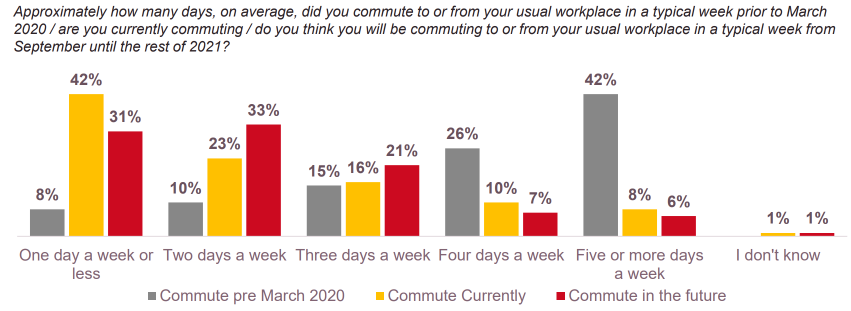
Of that 87%, nearly two thirds were commuting by train two days per week or less in August, and expected to do so for the remainder of 2021.
The number of individuals travelling by train is back to pre-Covid levels
One statistic that surprised me slightly.... According to Transport Focus 14.6% of the adult population used a train in February 2020. This dropped to 2.1% in May 2020, but has gradually recovered to 14.6% by September 2021.
The same number of people are using trains each month, but they are travelling less.
The number of trains timetabled is at 88% of pre-Covid levels
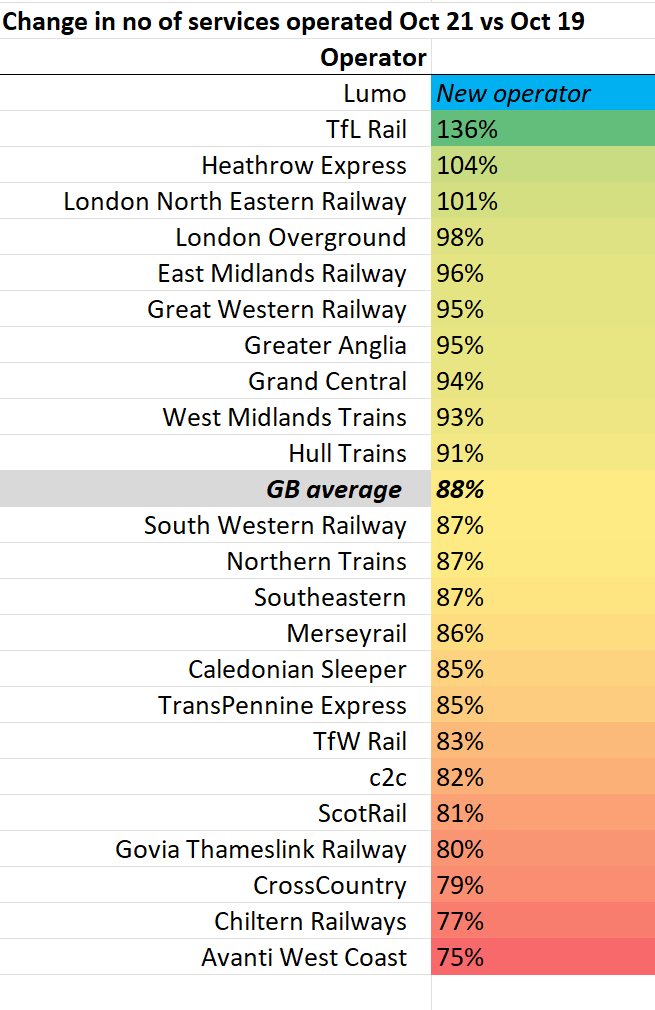
In October 2021 the number of services timetabled was around 88% of the number operated in October 2019, with significant variation by operator.
(In a few cases this was due to network changes, most notably the transfer of services from GWR to TfL Rail)
Freight km operated and tonnage were both up 0.7% over a comparable period.
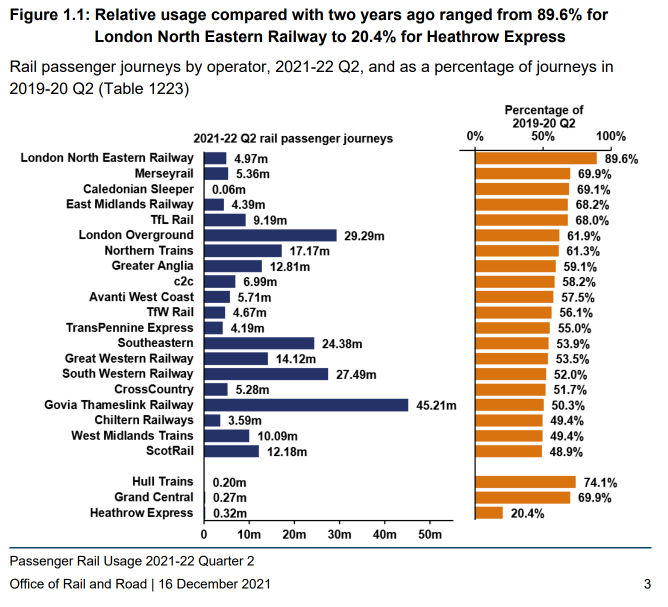
Passenger recovery is a mixed picture by operator and region
For the most recent published quarter (July - Sept 2021) the number of journeys made were at around 55% of the equivalent period in 2019. (As there were 12% fewer trains for 45% fewer passengers, this means on average passenger numbers per train are at about 63% of 2019 levels)
Again, there is notable variability by operator - for example LNER at nearly 90% of 2019 journeys (operating a similar number of services to 2019) compared to Avanti West Coast at 57.5% of journeys (operating 33% fewer services)
I've visualised the same data on a network schematic. Green shows the highest levels of recovery, red the least. It appears that operators in the north and east of England have seen the least drop in patronage. (Thank you to Andrew Smithers of www.projectmapping.co.uk for letting me hack his map (again!))
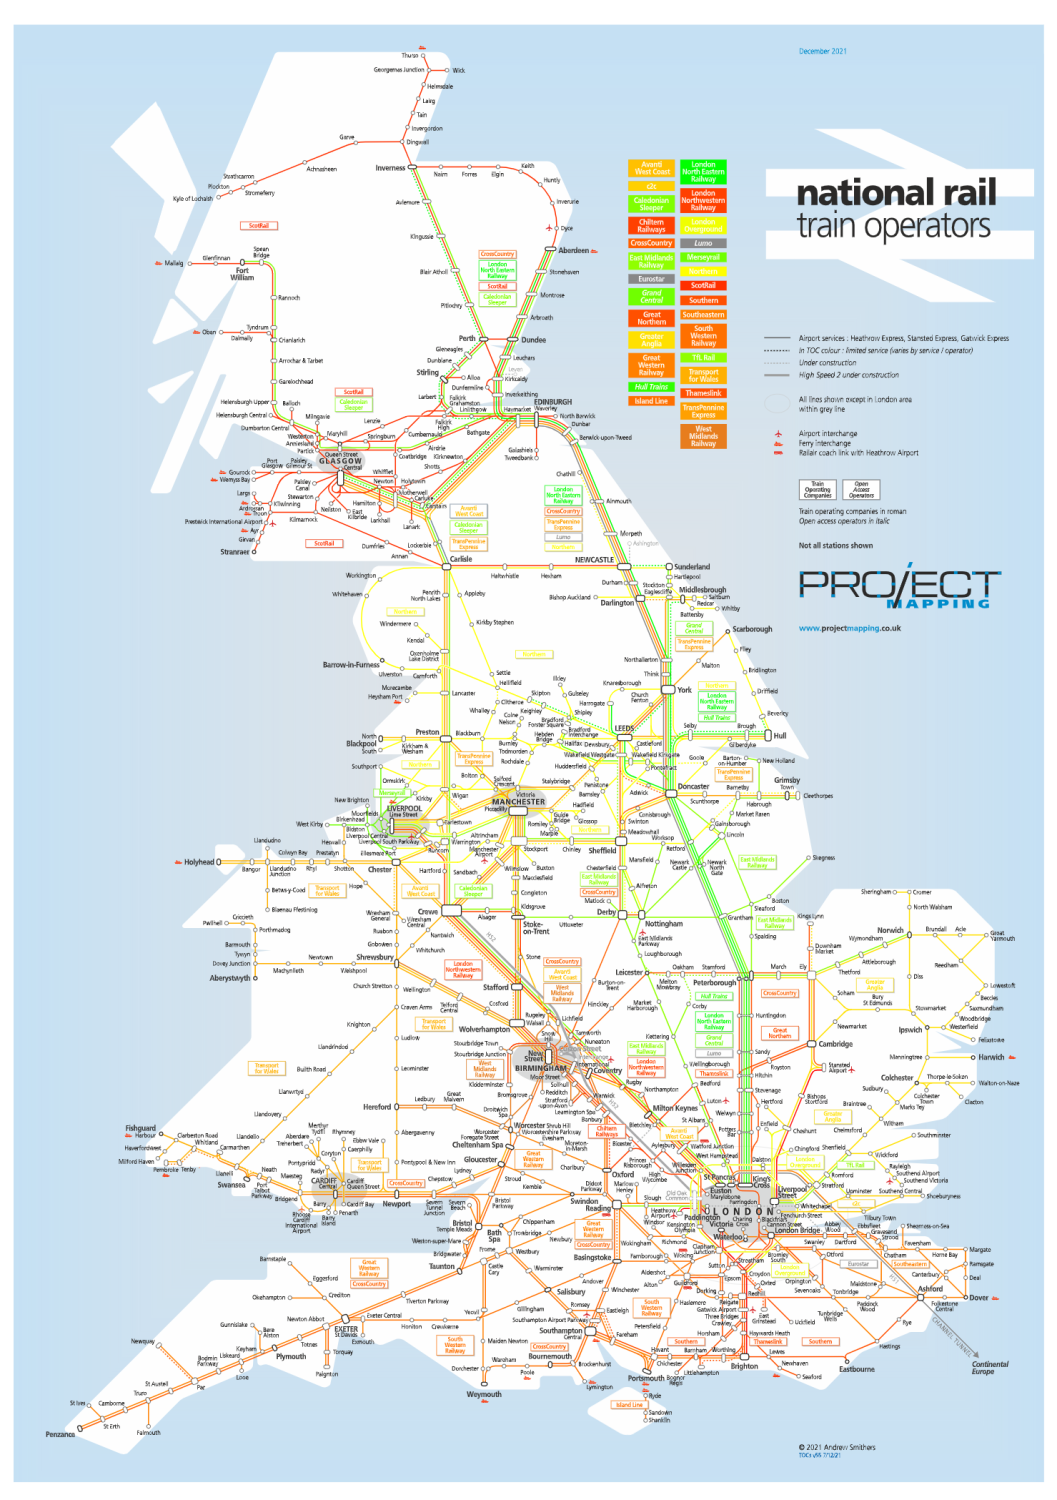
In practice this visualisation is somewhat imperfect, as it is only colour coded per operator. Large diverse operators (such as GWR) just end-up average, rather than showing the regional differences.
A different way of visualising the impact is to look at the % change in station footfall for each station. This shows the large drops at the main city terminus stations, and smaller drops in areas likely to be associated with leisure travel, such as coastal destinations (albeit recovery in Scotland and Wales underperforms this trend).
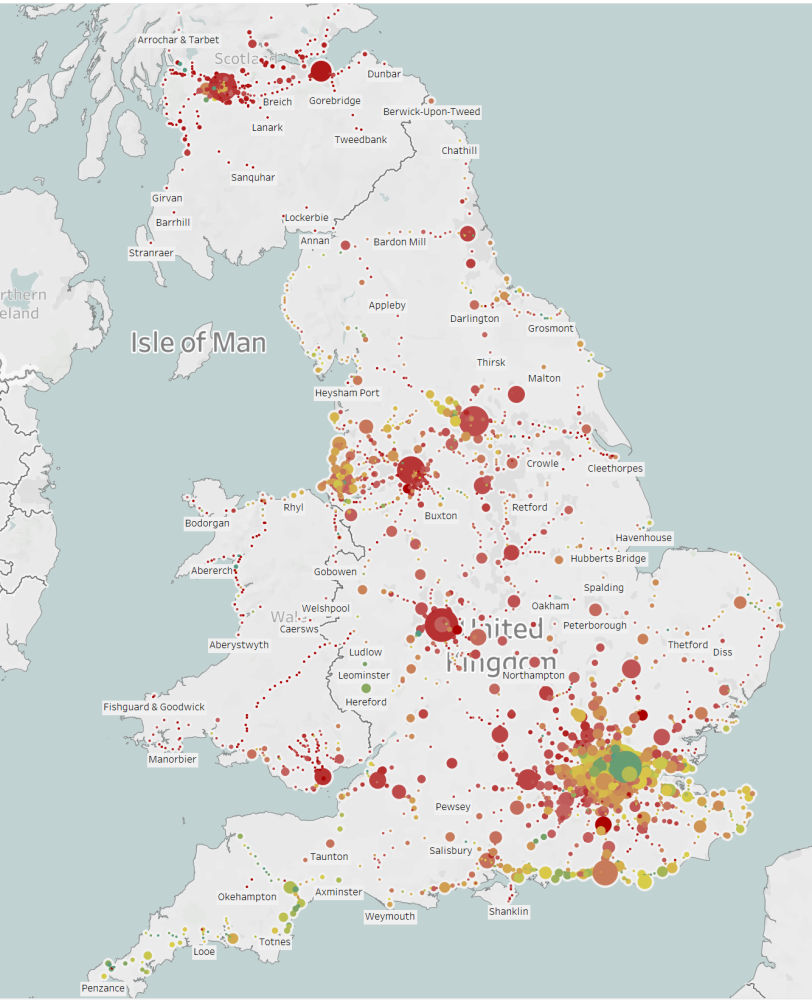
(nb: Due to when the data is published, this compares Apr 2019 - Mar 2020 with Apr 2020 - Mar 2021, so excludes much of 2021)
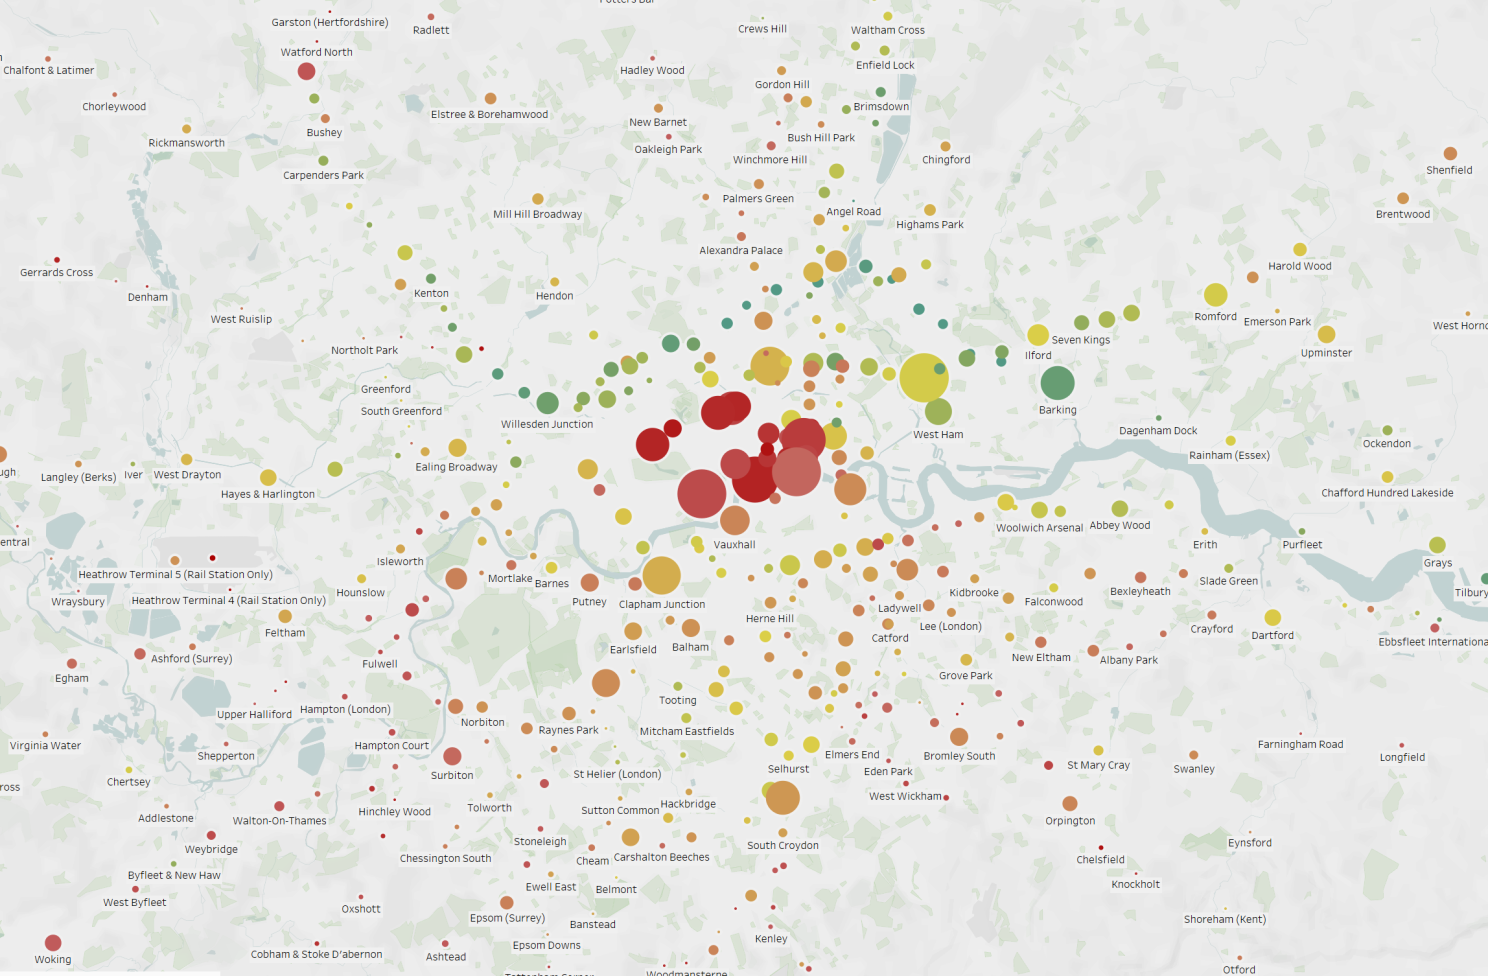
I was surprised to see so much green and amber around London, given that other stats suggest London was hit worse than average. Within London there is a more nuanced trend. Whilst the large terminus stations see large falls in footfall, London Overground performs relatively well.
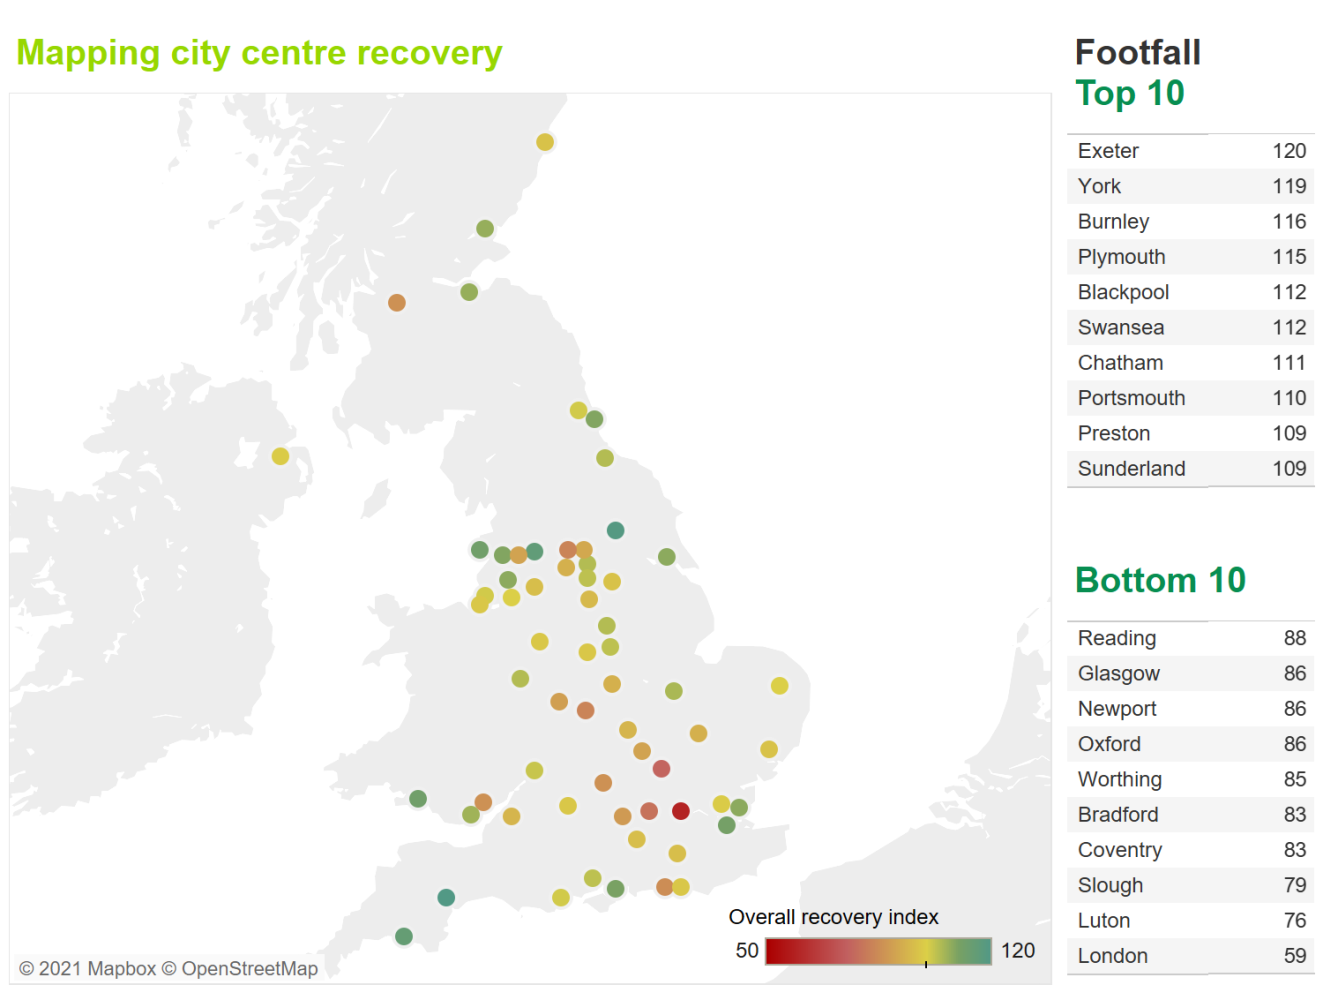
It's not just transport that has seen regional variation. The High Streets Recovery Tracker reported by Centre for Cities also show significant variation in footfall recovery in cities and towns more generally, with London at the bottom of the league (Compares the last week of November 2021 with pre-Covid levels)
How we buy tickets has changed considerably
Not long before the pandemic there was a quiet celebration from colleagues in online retail, as the value of online sales quietly overtook the value of booking office sales, both at around 28% of industry revenue at the time.
During Covid there has been two more digital milestones: (1) The number of journeys sold online overtook the number at booking offices for the first time, and (2) the value of online sales reached over 50% of industry revenue. Online retailers were some of the first in the industry to report their volumes returning close to pre-pandemic levels.
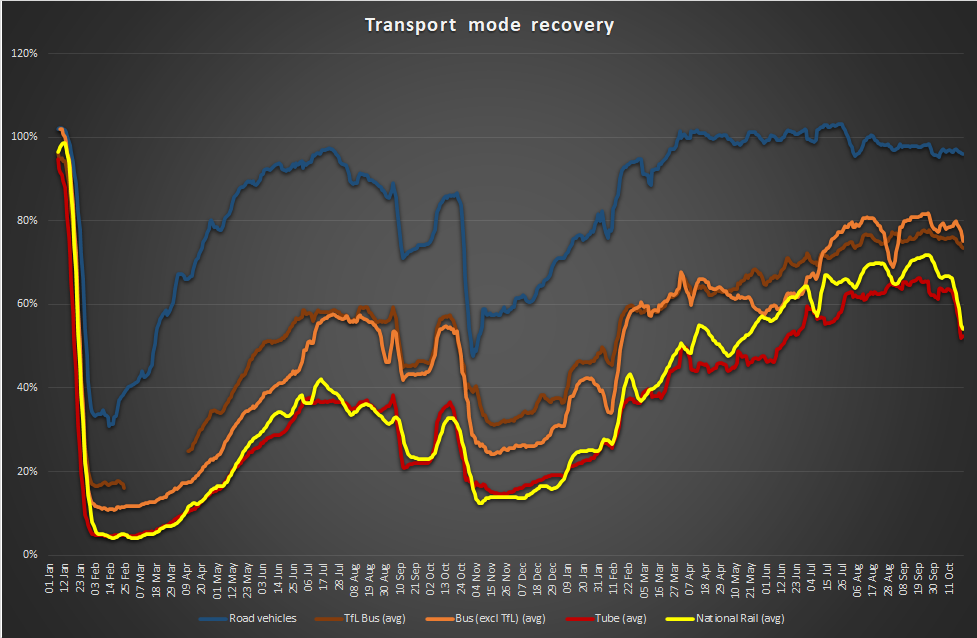
Bus is doing better than Rail, but Rail is doing better than Tube
The Department for Transport has been publishing weekly statistics on the relative recovery of different modes of transport. These show a similar trend across all public transport modes, albeit with bus performing ahead of rail, and rail slightly ahead of tube.
Those that are travelling are eating more Pret!
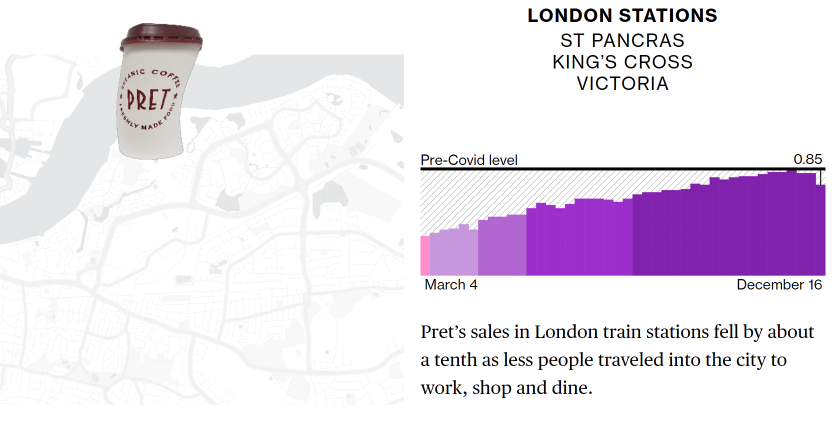
One of the more unusual barometers of passenger recovery is the Pret Index, which amongst other things reports Pret sales at London stations. This showed that in November Pret sales were back to pre-pandemic levels, despite journeys only being at around two thirds of pre-pandemics levels. Perhaps a result of changes in passenger demographics, and/or a reduction in alternative places to eat?
To conclude?
The pandemic has had not just a huge effect on travel itself, but the models and techniques used to forecast demand. No longer can we turn to trusted elasticity models to forecast gradual changes, we're in an era where things can change rapidly. Individuals may respond to surveys about their future plans, but do they really know themselves what will work for them, and what habits and preferences they will develop? How will that be influenced by Government decisions or simply the behaviour of others? How prescriptive will employers be about working patterns? Will the industry suffer a wave of industrial action as it seeks to cut costs? Will the industry be able to generate a sustained increase in leisure demand, or was it just a post-lockdown bounce? And if demand does return to pre-pandemic levels, will it be possible to provide the capacity required?